
Tag Archives: Boston Office Market
0 Boston Ranks Among Top Office Markets in U.S.

Credit: Bizjournals.com
Boston ranks 6th nationally for office vacancy.
According to a report on the BBJ, “at 12 percent vacancy, Boston’s office market dipped by 1.2 percent year-over-year and was the sixth-tightest in the U.S., the report said. New York and Washington, D.C. ranked as the tightest office markets, each with 9.1 percent vacancy, followed by San Francisco at 10.2 percent and Seattle at 10.9 percent.”
Additional details are available on its website, here.
0 Boston Ranks Fourth Among U.S. Cities in Jobs
Credit: Boston Business Journal
Boston falls in the top 5 for best city for a job in the U.S. Some of the hottest opportunities are: nurse practitioner, applications developer and sales development representative.
A recent report from Glassdoor “ranked Boston the fourth-best city in the U.S. for jobs. Last year, Boston was No. 15 on the list, sandwiched between Dallas-Fort Worth and Minneapolis-St. Paul…According to the report, there are 121,498 job openings in the Boston area with a median base salary of $67,500 and a median home value of $387,400. Some of the hottest jobs in Boston include nurse practitioner, applications developer and sales development representative.”
At the top of the list for best U.S. cities for jobs was San Jose, California (No. 1), followed by San Francisco (No. 2) and Seattle (No. 3). Washington, D.C. was No. 5 on the list.
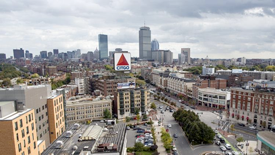
0 Boston Office Market Shows Strength in 2015
Credit: Boston Real Estate Times
The region’s office market continued its upward push with rents climbing while vacancy continues to decline.
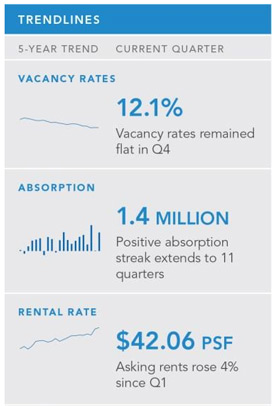
A Boston Real Estate Times article includes the following highlights to express the market direction:
- Market-wide vacancy averaged 12.2 percent for 2015, the lowest annual average since 2002. Vacancy for the quarter remained steady from third quarter at 12.1 percent.
- Class A asking lease rates topped $42 per square foot for the first time since 2002, reaching $42.06 in fourth quarter, 3.9 percent higher than first-quarter 2015.
- Boston’s Central Business District had 502,000 square feet of absorption in fourth quarter and totaled 1.58 million square feet for the year, the highest annual total since 2006.
- Vacancy in Boston’s Seaport District dropped to 8.3 percent, its lowest level since 2000, when inventory was 6 million square feet smaller than today.
- Cambridge closed the quarter at a remarkable 2.7 percent vacancy, its lowest mark on record.
- There was 314,000 square feet of positive absorption in the Route 128 submarkets and 328,000 square feet in the Interstate 495 submarkets.
0 Boston Office Market Closes 10th Consecutive Quarter of Positive Absorption
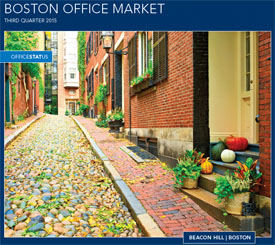
Credit: TransWestern.net
The Boston Office market continues ahead with its 10th positive quarter of absorption.
From TWurls.com:
Greater Boston’s office market closed its 10th straight quarter of positive growth, albeit at a much slower pace than the 15-year record high of 2 million square feet absorbed during second-quarter, according to “officeSTATus — Q3 2015,” a new research report from Transwestern | RBJ. Despite tenants absorbing only 36,000 square feet of office space during third-quarter 2015, the market has seen a robust 3.6 million square feet of positive absorption during the past 12 months Ë•’ a more accurate indicator of market strength.
“We were unlikely to maintain the pace that was set during the second quarter, which had the highest absorption rate since the dot-com boom in 2000,” said Northeast Research Director Chase Bourdelaise. “An important contributor to the robust 12-month absorption growth is the continued positive gains to the region’s office-using employment, which has increased 12.0 percent since 2009.”
0 Tech Sectors Driving Boston Office Market Growth
Tech tenants are driving office demand nationwide with Boston ranking number 7 falling just behind Seattle. To be classified as a tech talent market, there must be a labor pool of at least 50,000.
Desired Options:
· Food Options
· Shopping
· Wellness Center
· Outdoor Space
· Recreation Room
· Onsite Daycare
· Bike Storage/Bike Rental
· Zip Car
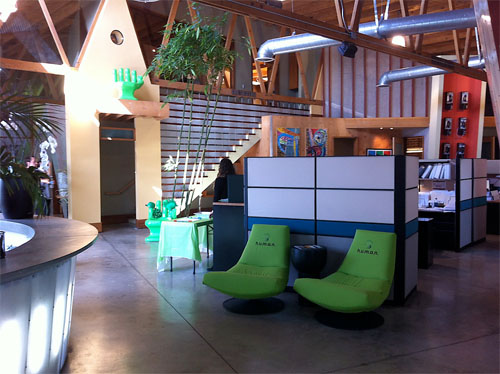
Credit: Forbes
To view some of Boston’s coolest office designs, check out Forbes’ online gallery.
0 Boston Office Market Continues to Soar

Credit: Nerej.com
Rents are on the move, upward and don’t see any signs of letting up. Class B product in the Downtown Crossing (DTX) area of the city have seen increases from the high $20’s a couple of years ago to the low $40’s. Future predictions expect the 2016 levels to surpass the 2000 and 2007 markets peaks.
Nerej.com notes, “the city of Boston office market is absolutely exploding. 1.72 million s/f of office space was absorbed in 2014, 35% more than in 2013, and 50% more than in 2012. What statistics do not show is that Boston as a city has $110 billion in total assessed value for all its properties; $4 billion in new construction breaking ground, 4,500 current job openings and 44 tech IPO’s in the pipeline. 50% of total absorption in 2014 was urban migration from the suburbs. As of the start of 2015, there are 222,000 s/f of tenants in the market for downtown space alone.
You can read more about the Boston Office Market explosion on Nerej.com.
0 Office Space Super Bowl

Credit: rejournals.com
Office Vacancy and the Super bowl, the city with the highest vacancy rate wins.
REjournals compared Boston and Seattle’s office markets, citing a correlation between office vacancies and Super Bowl victories: “according to JLL, NFL teams based in cities with higher office vacancy rates have won the Lombardi Trophy 60 percent of the time in the past 15 seasons, including seven straight years from 2000 through 2006…This year, Boston’s office vacancy rate is 14.7 percent while Seattle’s is 10.7 percent. Based on this statistic, the odds favor New England.”
You can read the complete analysis on rejournals.com.
0 Downtown Boston Office Market Expanding Steadily

Credit: B&T
Downtown Boston is the largest concentration North of New York City and is in the midst of strong rent growth across the Class A and B segments. Today’s technology and creative services companies are looking for easy access to public transportation combined with an open floor plan.
From Banker & Tradesman:
For the third straight year in 2014, the Greater Boston office market recorded more than 2 million square feet of positive absorption, in a steady expansion that boosted occupancy rates at properties ranging from suburban office parks to converted warehouses and downtown high-rises.
“There’s more office product than ever and it’s getting filled in a much more dense way than ever before,” said Brendan Carroll, vice president of research for Avison Young. “If you’re wondering why the T seems more packed, or why you can’t get a cab to take you across the (Fort Point) Channel, that seems to be the reason.”
0 Boston Real Estate Valued at More than $100B
Boston is a $100 billion dollar city and the hub’s office tenants will be paying for it. Expect your office lease rates to rise with the new year’s tax bill.

Credit: The Boston Globe
From the Boston Globe:
“With the [Boston] real estate market surging, the total estimated value of its residential and commercial property jumped over that threshold for the first time and has climbed to a total of $110 billion, according to a new city assessment…The increase will mean significantly higher tax bills for many property owners next year, although the extent of those increases will not be known until tax rates are set in the coming days…To stave off sticker shock, the city’s assessing department has already begun reaching out to owners in some neighborhoods where values have increased the most.”